The Climate Emergency
The most consequential issue in human history. The data is clear, the economic case is overwhelming, and Canada's federal and provincial leaders both Conservative and Liberal are moving backwards.
All data sourced from peer-reviewed science and institutional reports: NASA, WMO, IPCC, Swiss Re, Munich Re, Deloitte, and the Government of Canada. Click any card to expand sources.
NASA GISTEMP 1880-2024
145 Years of Temperature Data
Every year since 1880, relative to the 1951-1980 average. Blue is cooler. Red is warmer.
NASA GISTEMP 1880-2024
Global Temperature Anomaly
Each stripe is one year. Blue = cooler than average. Red = warmer than average. Hover for details.
Hover a stripe to see the year
NASA GISTEMP Zonal Means, 1880-2025
Warming by Latitude, Year by Year
Drag the slider or press play. The poles heat up faster than everywhere else, especially the Arctic.
WMO, May 2026
What Comes Next
New projections from the World Meteorological Organization for 2026-2030. These are not worst-case scenarios. They are central estimates from the world's leading climate science body.
chance of exceeding 1.5 degrees C in at least one year this decade
probability one year surpasses 2024 as warmest on record
above pre-industrial levels in 2024. We already breached the target.
Arctic warming above recent averages, November through March
chance the 2026-2030 average exceeds 1.5 degrees C
At current global emissions, the 1.5°C carbon budget is nearly exhausted
The Global Carbon Budget 2025 report found the remaining budget for a 50% chance of holding warming to 1.5°C is down to roughly 170 billion tonnes of CO2. At current global emissions of about 40 billion tonnes per year, that is approximately four more years of emissions at today's rate before the budget runs out entirely.
Source: Global Carbon Budget 2025, Global Carbon Project
IPCC SR1.5, AR6, Science 2022
What Happens Past 1.5°C
Several of these consequences are permanent on any timescale that matters to human civilization. Cooling the planet back down later does not undo them. The window to avoid them is closing.
Coral Reef Collapse
of coral reefs destroyed at 1.5°C. At 2°C, virtually all of them.
Reefs took millions of years to form. At 2°C we lose 99% of them, and there is no version of "later" that brings them back.
Ice Sheet Destabilization
of committed sea level rise from Greenland and West Antarctica combined, even if temperatures later fall
Once marine ice sheet instability begins, it runs on its own. No future emissions cut reverses it.
Permafrost Carbon Feedback
tonnes of carbon currently frozen in Arctic permafrost, twice the amount in the atmosphere today
This is a feedback loop, not a one-time release. Once it runs at scale, it keeps going regardless of what emissions do next.
Amazon Rainforest Dieback
deforestation rate that, combined with warming, may tip the Amazon from rainforest to savanna
The eastern Amazon has already flipped from absorbing carbon to emitting it. This isn't a future risk, it's underway.
Mass Human Displacement
people projected to be displaced by climate impacts by 2050 under current trajectories
This would be the largest forced migration in human history, and the infrastructure to handle it doesn't exist anywhere.
Extreme Heat Exposure
of the global population exposed to severe heatwaves every 5 years at 2°C, versus 14% at 1.5°C
Half a degree of warming more than doubles the share of the world exposed to severe heatwaves. This is the most controllable tipping point on this list.
van Westen et al., Science Advances 2024
AMOC: The Ocean Conveyor Belt
One of the most consequential tipping points, and one with an active early warning signal that has been declining for 40 years.
What is AMOC?
The Atlantic Ocean has a massive conveyor belt. Warm water flows north from the tropics along the surface, releases heat (keeping Europe and Atlantic Canada temperate), then cools, sinks, and flows south along the bottom. This system is called the Atlantic Meridional Overturning Circulation, or AMOC. It is why London is warmer than Winnipeg at the same latitude. It is why Atlantic Canada has the climate it does. Without it, the North Atlantic region cools dramatically.
AMOC is kept running by differences in water density: warm salty water sinks when it cools. Fresh water from melting ice sheets disrupts this because fresh water does not sink as readily as salt water. As Greenland melts, it pours fresh water into the North Atlantic, weakening the pump. A 2024 paper in Science Advances found that a key indicator of AMOC stability has been declining for 40 years straight, and that this type of signal typically precedes collapse by only 25 years.
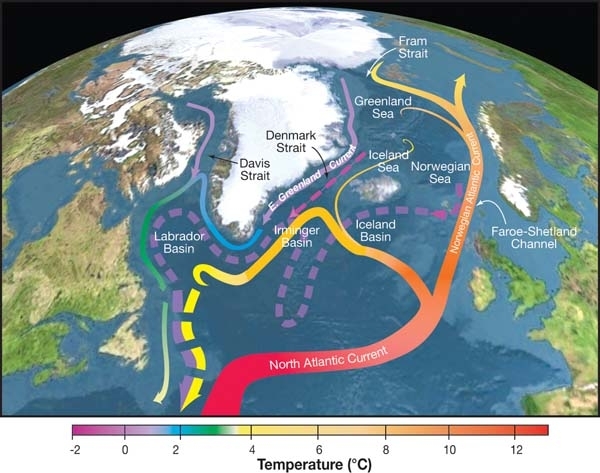
Source: Johnson, G.C. & Lumpkin, R. (Eds.), State of the Climate 2012, NOAA / Wikimedia Commons (CC BY 4.0). Arrow colors indicate water temperature (-2 to 12°C).
Cascade Effect: van Westen et al. 2024
AMOC collapse would cut Amazon rainfall by ~40%
The Amazon rainforest depends on moisture recycling that is linked to Atlantic circulation patterns. Models show an AMOC collapse would reduce precipitation over the Amazon basin by roughly 40%, potentially pushing it past its own tipping point into savanna. One collapse triggers another. The authors describe this as a "tipping cascade," a chain of irreversible changes that, once started, cannot be halted by any policy intervention.
average warning before collapse once tipping begins
of continuous destabilization already detected in ocean data
cooling across Europe and the North Atlantic within decades of collapse
sea level rise on Atlantic coasts from AMOC collapse alone, on top of baseline projections
how far south sea ice could expand, roughly the latitude of London, Paris, and Winnipeg
Swiss Re, Deloitte, Munich Re
The Economic Reckoning
The financial case for inaction has collapsed. Every major financial institution that has modelled the numbers reaches the same conclusion: climate destruction costs vastly more than climate action.
Global GDP Loss Under High Emissions
The financial industry's own models say inaction costs more than the entire U.S. economy, and that's the optimistic version.
Cumulative Global Inaction Cost
Deloitte modelled both paths, and doing nothing costs four times more than fixing it.
A Decade of Rising Disaster Losses
This is a decade-over-decade trend, not a single bad year, and it's been climbing steadily since 2000.
Canada's Annual Climate Bill
This number assumes Canada actually adapts, and the government rolling back climate policy undermines the assumption it's built on.
Canadian Heat Wave Costs
A once-in-a-millennium heat event killed 619 people in a week in 2021. Events like it are becoming routine, not rare.
Munich Re NatCatSERVICE 2000-2023
Global Natural Disaster Losses
Total economic losses in USD billions. Hover a bar for details.
Canadian Climate Institute, Environment Canada
Why Canada Should Care
Canada contributes a small share of global emissions but is among the most exposed countries to warming's consequences. The geography is not in our favour.
Environment and Climate Change Canada
Canada's Disproportionate Exposure
Canada contributes a small share of global emissions but experiences outsized warming.
1.5%
of global emissions
Canada's share of worldwide greenhouse gas output
2x
the global warming rate
Canada warms twice as fast as the global average. The Arctic warms 4x faster.
Canada's geographic position means it absorbs warming effects far exceeding its emissions share. Low contribution to the cause does not translate to low exposure to the consequences.
Canadian Climate Institute, Quebec, annually
Heat's Annual Toll in Quebec
Current annual figures at today's temperatures, before mid-century warming.
Canada's Changing Climate Report, 2019
How Fast Different Parts of Canada Are Warming
Warming since pre-industrial baseline vs. global average. Canada's north is among the fastest-warming places on Earth.
2023 Canadian Wildfire Season
The 2023 Wildfire season was not an abnormal weather event. It was the outcome of a warming climate alongside boreal forests becoming dry fuel over decades of increasingly warmer springs and summers. Canadian wildfire seasons are projected to double in severity by 2050 under current trajectories. The federal government's own projections show wildfire suppression costs exceeding $1.4B annually by mid-century.
Sources: Canadian Interagency Forest Fire Centre (CIFFC); Natural Resources Canada; Government of Canada 2024 National Adaptation Strategy
What You Can Do
Take Action
Data is only useful if it leads somewhere. Here's where to take it.
Find and Contact Your MP
Look up your riding, see who represents you, and tell them directly what you think of Canada's climate record.
Find your MPSee How Every MP Voted
Filter the full House of Commons voting record by climate and environment issues. Every vote, every MP, on record.
View climate votesJoin an Organized Campaign
350.org Canada organizes campaigns and petitions pushing federal investment in clean energy. Add your voice.
Visit 350.org CanadaSource material: NASA GISTEMP, WMO 2026 Projections, Swiss Re Institute, Deloitte, Munich Re, Government of Canada, DeSmog. This page presents sourced data. Read source material for full context.